
Unlock Hidden Value in Your Solar Assets
Increase cash flows, extend asset life, and strengthen ESG positioning across your renewable portfolio.
The Case for Regenerative Enhancement
Regenerative enhancement delivers measurable value across multiple investment dimensions
Cash Flow Enhancement
3-5% yield improvement translates directly to distributions. On a 100MW park, that's €180-300k annually.
Asset Life Extension
Cooler panels degrade slower. Add 1-5 years of productive life to your assets.
ESG Differentiation
Biodiversity net gain, carbon sequestration, community benefits. Real metrics, not greenwashing.
Exit Value
Assets with proven regenerative performance command premium valuations.
Tailored for Investment Management
Purpose-built services for every stage of the investment lifecycle
Due Diligence Support
Pre-acquisition assessment of regeneration potential
Portfolio Optimization
Rank assets by intervention ROI
ESG Reporting
Automated biodiversity and carbon metrics for LP reports
Exit Preparation
Documentation that supports premium valuations
Investment-Grade Analysis
Our projections meet the rigorous standards of institutional investors. Every assumption is documented, every model is auditable.
Investment-Grade Standards
Data-Driven Investment Decisions
Our financial models provide the transparency and rigor institutional investors demand
IRR Probability Distribution
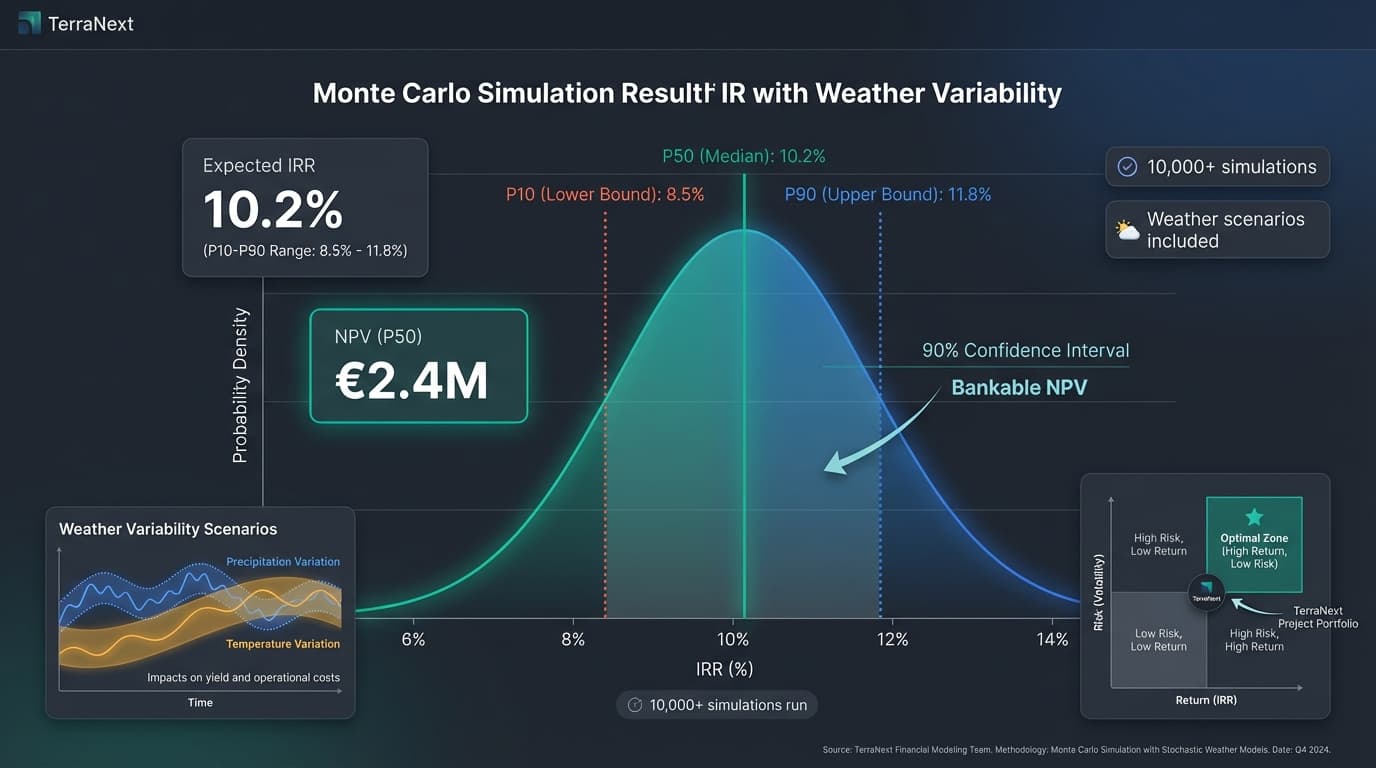
10,000+ scenario Monte Carlo analysis provides P10/P50/P90 IRR projections, giving investors clear visibility into risk-adjusted returns.
Cashflow Enhancement
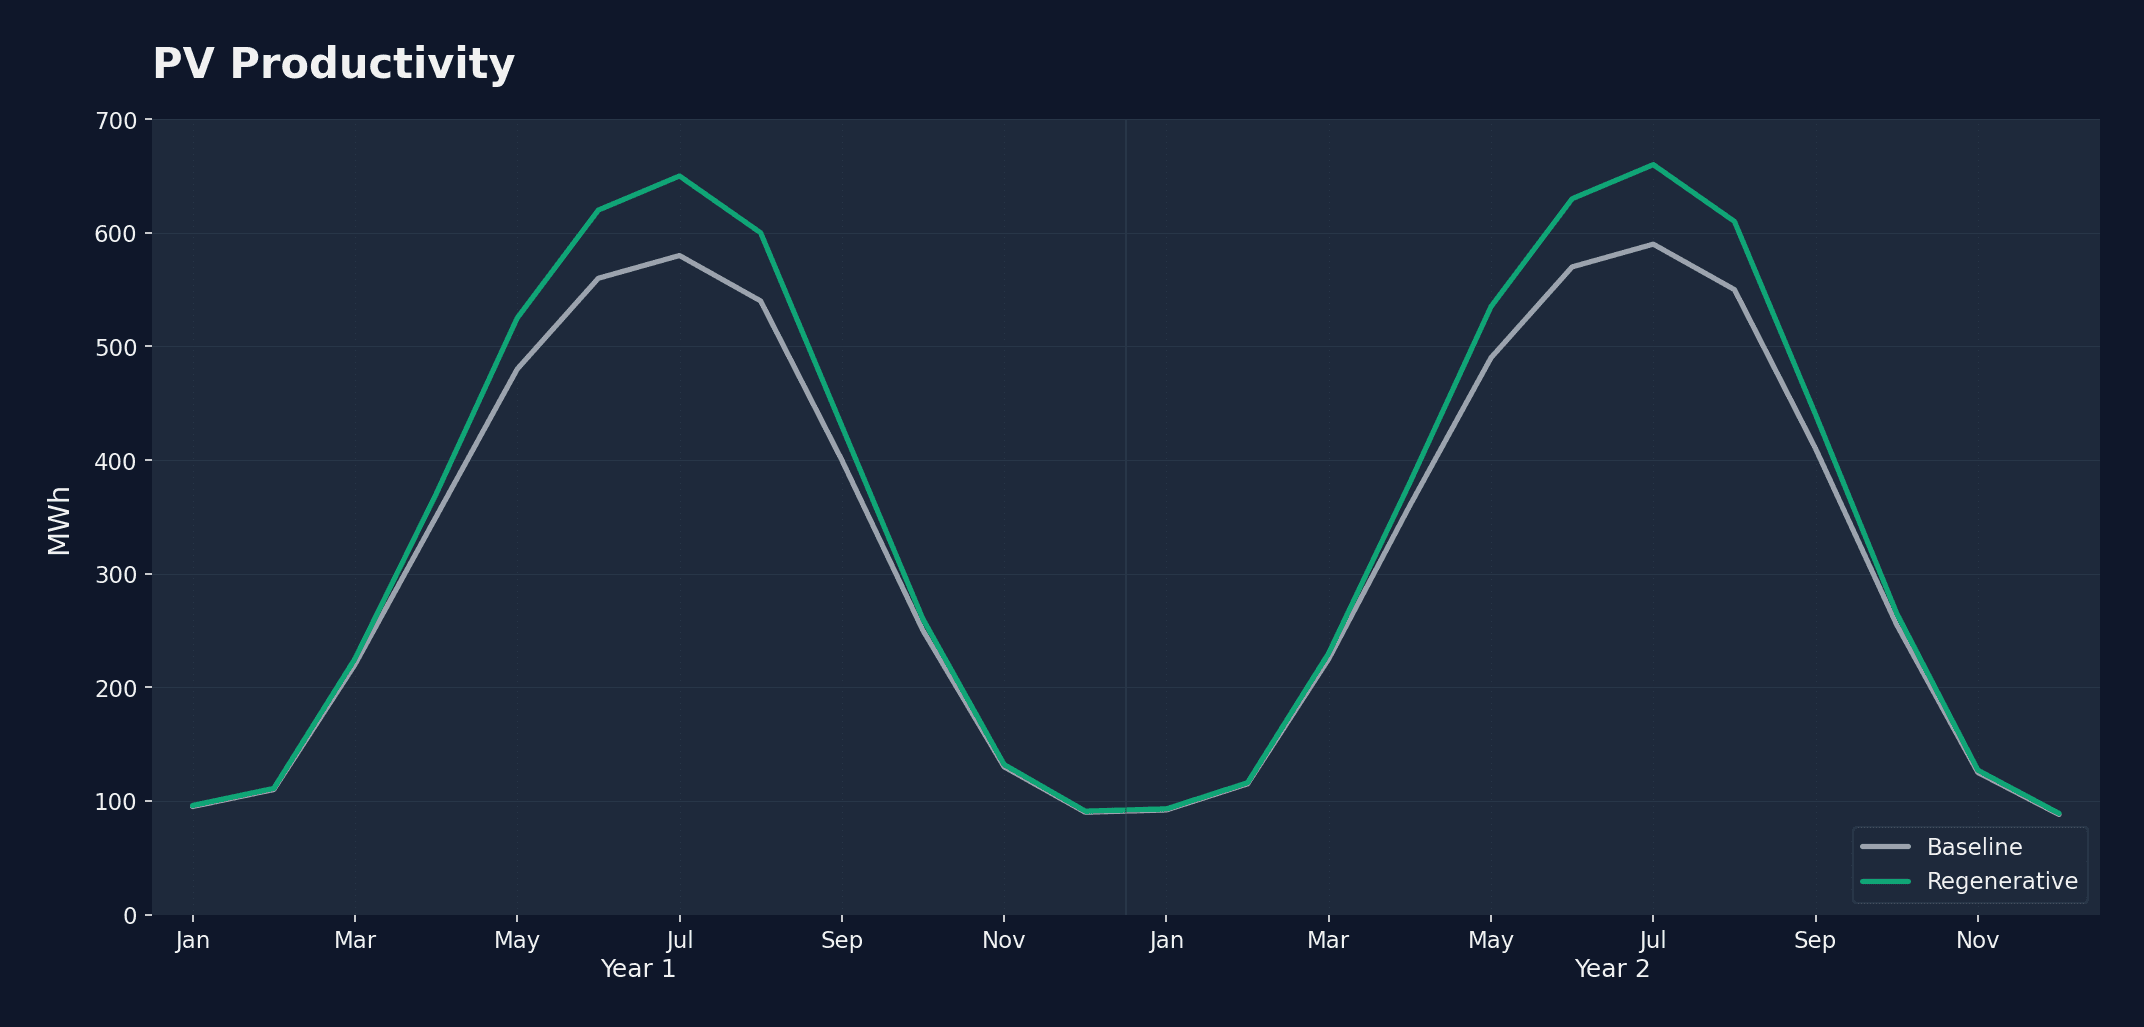
Side-by-side comparison of traditional vs regenerative approaches, demonstrating the cumulative financial impact across asset lifetime.
De-Risk Your Investment
Multiple safeguards protect your investment at every stage
GO/NO-GO Gates
GO/NO-GO gates at every phase
Guarantees
Performance guarantees (structure TBD)
Insurance
Insurance implications addressed
Regulatory
Regulatory tailwind (not headwind)
Get Asset-Level Analysis
Investment-grade projections for your portfolio