Managing Multiple Parks Creates Unique Challenges
Performance Variance
Your best park produces 15% more than your worst. What if you could close that gap?
Capital Allocation
Which parks should get regeneration investment first? We rank by ROI potential.
Standardization
Different contractors, different approaches, inconsistent results. One methodology, proven outcomes.
ESG Reporting
ESG reporting across 50 parks? Our dashboard aggregates biodiversity and carbon metrics.
Fleet-Wide Optimization Strategy
Fleet Prioritization Tool
Upload your portfolio, get ranked recommendations within 72 hours
72 hoursEnterprise Dashboard
Single view of all parks, all metrics, all projections
Single viewStandardized Implementation
Same methodology, adapted to each site's specific conditions
Proven methodologyBulk Economics
Volume discounts, phased rollout, capital efficiency
Volume discountsFrom Opportunity to Impact
Track your portfolio's journey through our proven deployment process. See where resources are committed and results are emerging.
Opportunities
Identified & Assessed
Design Progress
18 projects active
Generating Value
12 parks active
Sites assessed with NPV calculated. Ready for design prioritization based on ROI potential.
Engineering in progress. From preliminary assessment through finalized plans to permitting.
Active regenerative systems generating measurable yield improvements and revenue.
Estimate your potential recovery across your entire fleet
Portfolio ROI Calculator
Calculator Results
* Estimates based on 3.5% yield improvement (medium-intensity intervention), 35 EUR/MWh energy price, 18% capacity factor, and 8% discount rate. Actual results may vary based on site conditions.
Your Best Park Outperforms Your Worst by 15%.We Close That Gap.
Our IoT-enabled monitoring and AI analysis identifies optimization opportunities across your entire fleet, prioritizing interventions by ROI potential.
Baseline vs Regenerative Cashflow
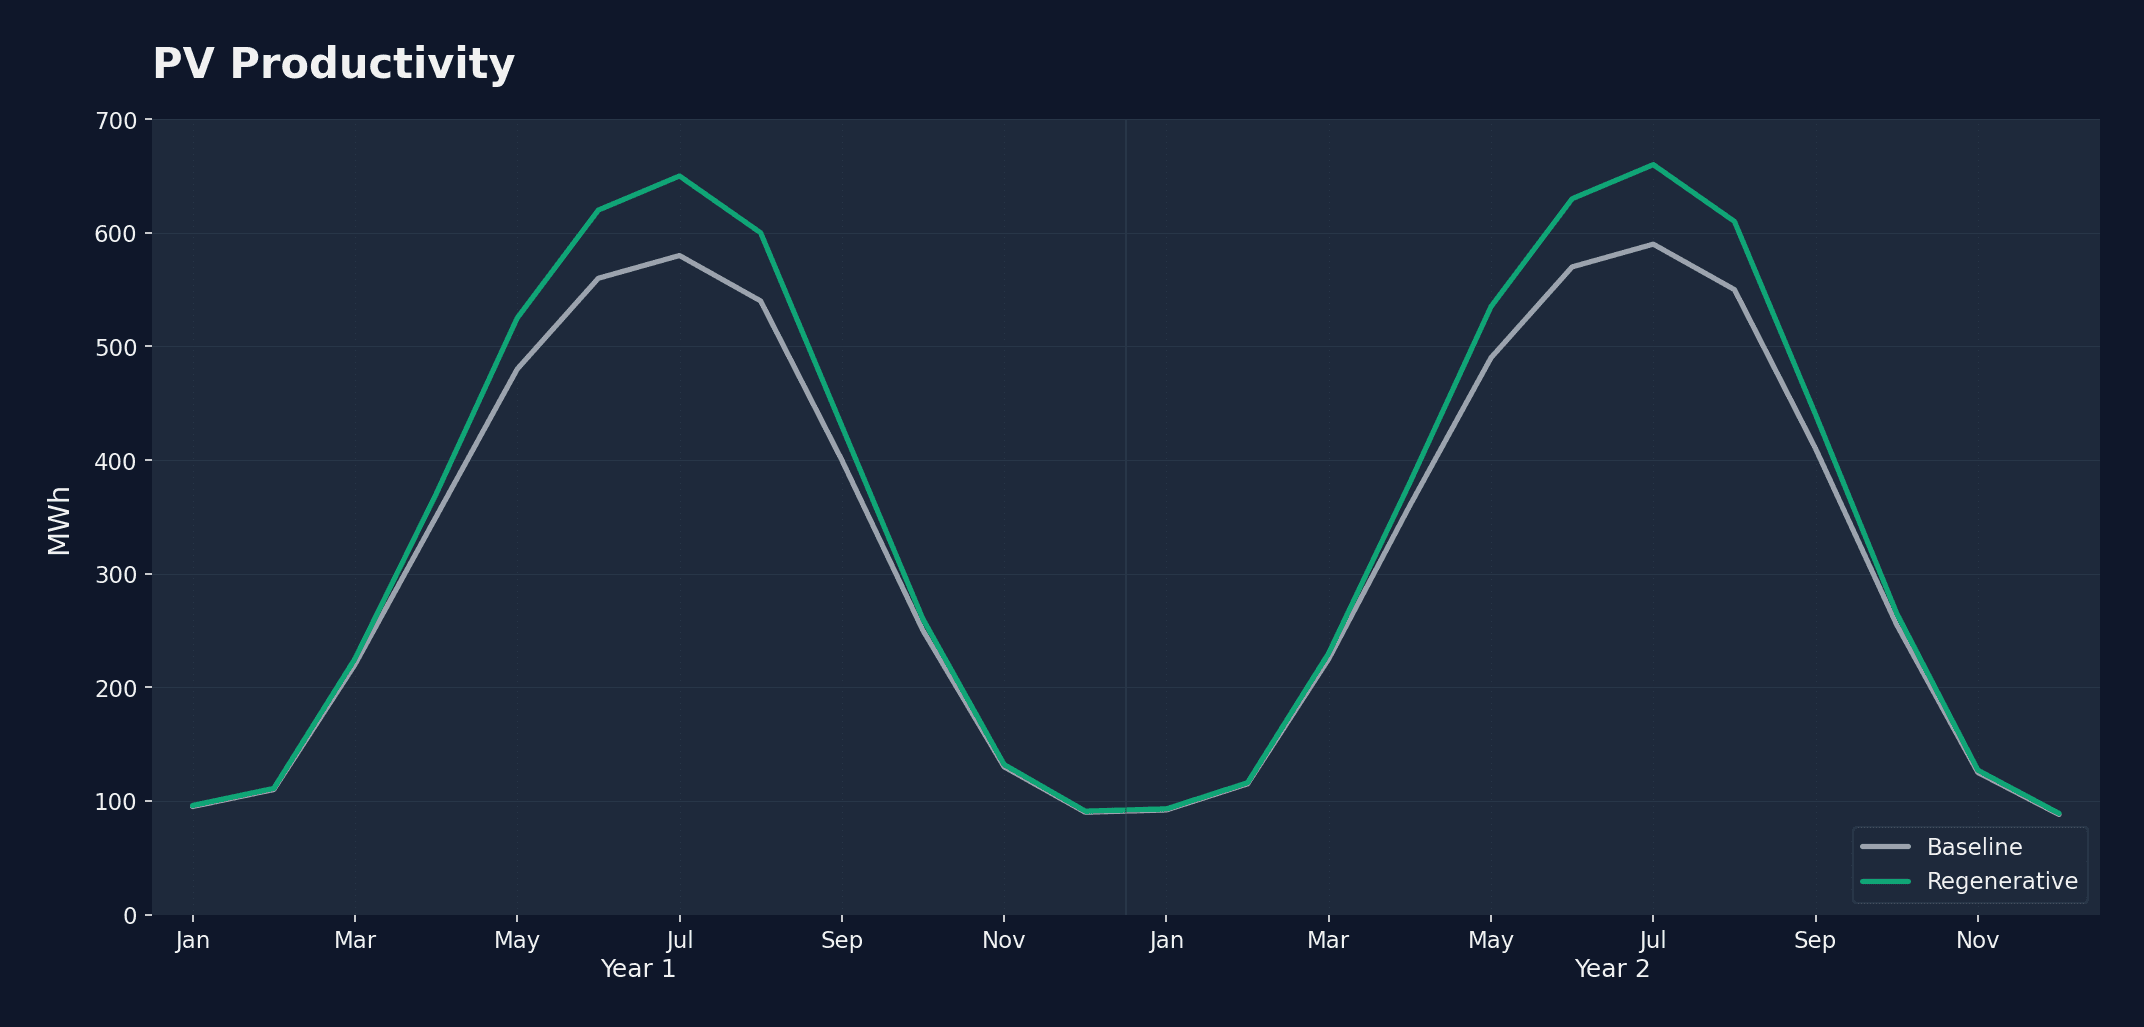
Side-by-side comparison of traditional vs regenerative approaches showing P25/P50/P75 confidence intervals for informed decision-making.
Fleet Monitoring Dashboard
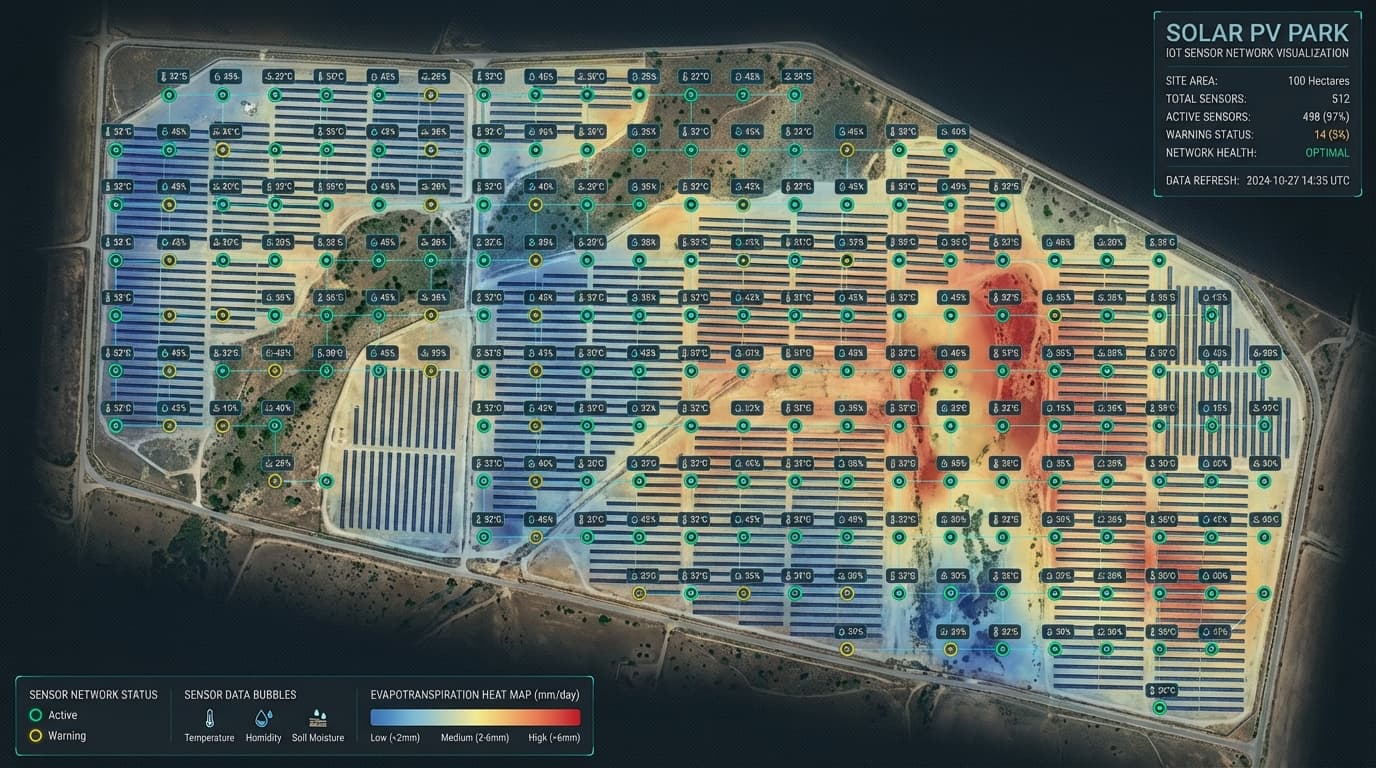
Real-time monitoring across your portfolio with automated alerts and optimization recommendations ranked by impact.
“A 500MW portfolio operator identified €2.4M in annual recoverable value across 8 parks, with 3 parks showing >25% IRR potential.”
European Portfolio Operator500MW across 8 parks
Get Your Portfolio Assessment
Free initial analysis of your entire fleet